
Goodness
Onwuasoanya
I am an experienced data analyst with a strong background in business intelligence, data visualization, and financial analysis. With expertise in Power BI, Excel, and SQL, I have worked on projects involving sales analysis, churn prediction, and customer segmentation. My ability to clean, transform, and analyze large datasets allows me to derive actionable insights that drive business decisions. My analytical skills, combined with a keen eye for detail, make me proficient in delivering high-quality data solutions.

Why Work with Me
Data-Driven Decision Making
I go beyond numbers, uncovering trends that help businesses optimize performance and increase profitability
Expert in Visualization & Reporting
With my Power BI and Excel expertise, I create clear, interactive dashboards that turn complex data into actionable insights..
Business-Focused Approach
I don’t just analyze data—I align my findings with business goals, ensuring data-driven strategies that lead to real growth.
Attention to Detail & Accuracy
From data cleaning to reporting, I ensure precision in every step of the analysis process
"Every dataset holds a story—my job is to uncover it and turn it into insights that drive action."
2024
1. Understanding the Problem
Before diving into any dataset, I take time to understand the business problem I’m solving. This involves: Engaging with stakeholders to define goals. Asking key questions about the data and desired insights. Establishing success metrics.
2. Data Collection and Preparation
The next step is gathering relevant data and preparing it for analysis: Importing datasets from different sources. Cleaning and transforming the data in Power BI or Excel. Handling missing values and inconsistencies.
3.Exploratory Data Analysis (EDA)
At this stage, I explore the dataset to identify patterns and trends: Conducting summary statistics. Visualizing key variables. Identifying outliers and anomalies.
4. Building Meaningful Visualizations
Visualization is where the data comes to life. I create: Interactive dashboards using Power BI. Charts and graphs to communicate insights effectively. Dynamic reports that allow stakeholders to explore data easily.
5. Generating Insights and Storytelling
Data analysis isn’t just about numbers; it’s about telling a compelling story: Translating complex data findings into actionable recommendations. Presenting insights in a way that is accessible to non-technical audiences. Using storytelling techniques to engage stakeholders.
6. Continuous Improvement and Documentation
Finally, I document my work and seek feedback for continuous learning: Keeping track of methodologies and decisions. Iterating on reports and dashboards based on feedback. Learning from past projects to enhance future analyses.
"Turning data into insights, insights into strategy, and strategy into success."
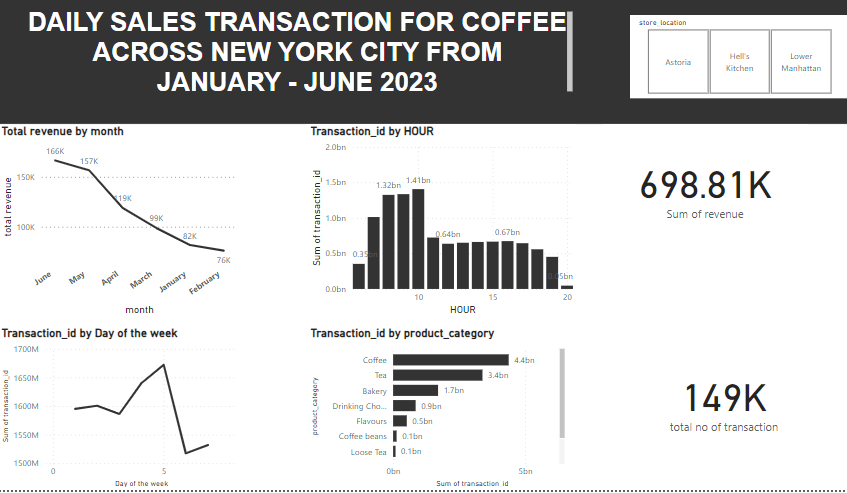
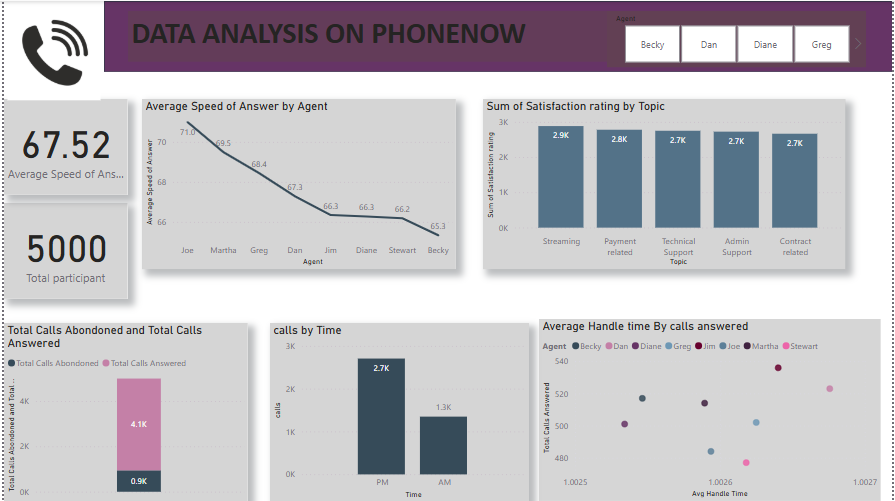
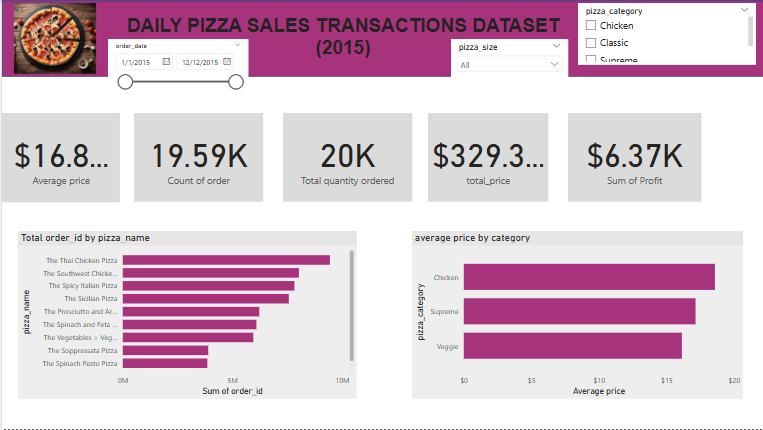
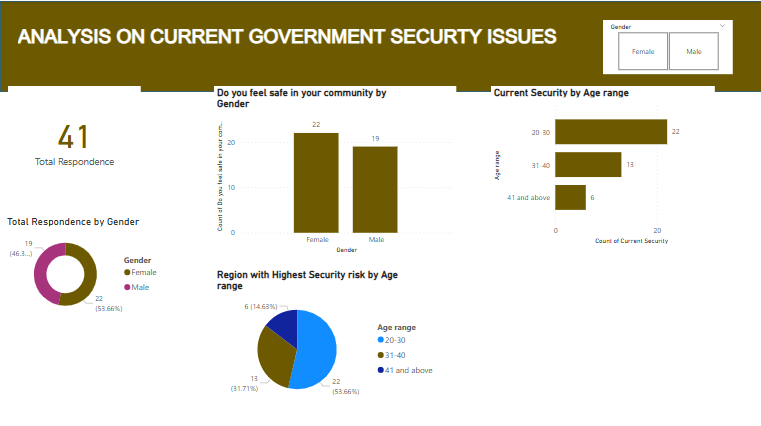
Data Analysis & Visualization
Cleaning, transforming, and analyzing data to uncover meaningful trends.
Creating interactive Power BI dashboards and reports for real-time insights.
Crafting compelling data stories that help businesses make informed decisions.
Business Intelligence & Strategy
Identifying key performance metrics to track business success.
Conducting trend analysis and forecasting to support strategic planning.
Delivering data-driven recommendations for process optimization and revenue growth.
Data Management & Reporting
Organizing and structuring raw datasets for better accessibility.
Automating data workflows to improve efficiency.
Generating reports that provide clear insights for stakeholders.
Data is more than numbers; it's the key to unlocking powerful insights and driving impactful decisions.
Hello! I’m Goodness Onwuasonya, a passionate Data Analyst with expertise in Power BI, Excel, and SQL. I specialize in transforming raw data into meaningful insights that drive business growth and strategic decision-making. With a background in data analytics, business intelligence, and storytelling, I thrive on uncovering trends, solving complex problems, and helping businesses make data-driven decisions. My experience spans across data visualization, reporting, and performance analysis, ensuring that every piece of data tells a compelling story. Beyond analytics, I am a strong communicator and collaborator, working closely with stakeholders to deliver actionable insights. Whether it’s building interactive dashboards, conducting trend analysis, or optimizing data workflows, I bring a structured and creative approach to every project. I’m always eager to take on new challenges, explore innovative solutions, and contribute to projects that make an impact.
02+
Years of Experience
Good number of experience in delivering exceptional projects.
20+
Projects Delivered
Decades of expereince in deleivring exceptional projects.
98%
Client Satisfaction
I build long-term partnerships through proven results.
My Success Stories
I take pride in collaborating with a diverse range of clients, from ambitious startups to established enterprises.
Goodness demonstrated exceptional skills in data cleaning and visualization, ensuring that our reports were accurate, clear, and insightful. Their contributions significantly improved our data-driven decision-making processes”
Goodness exhibited remarkable analytical skills and professionalism throughout their internship. Their ability to interpret data and provide meaningful recommendations made them a valuable asset to our team

Generating reports that provide clear insights for stakeholders.
Generating reports that provide clear insights for stakeholders.